Types of Infographics
Infographics have become an essential tool for businesses, marketers and educators looking to present complex information in a visually appealing and easy-to-understand format. With the rise of digital media, the demand for infographics has skyrocketed, leading to the development of various types of infographics.
As a result, it is crucial to understand the different styles of infographics and choose the right one for your project. In this article, we will explore the different types of infographics and guide you in selecting the perfect style to effectively convey your message.
One of the primary reasons for the popularity of infographics is their ability to visualize complex data and information. By using visual elements such as charts, graphs, maps and icons, infographics can make even the most complicated data more engaging and accessible.
As a result, infographics have become an effective tool for data representation. With the help of infographics, you can understand and present data trends, patterns and relationships at a glance. This visual representation is more effective than traditional text-based formats as it allows readers to grasp information quickly and retain it longer.

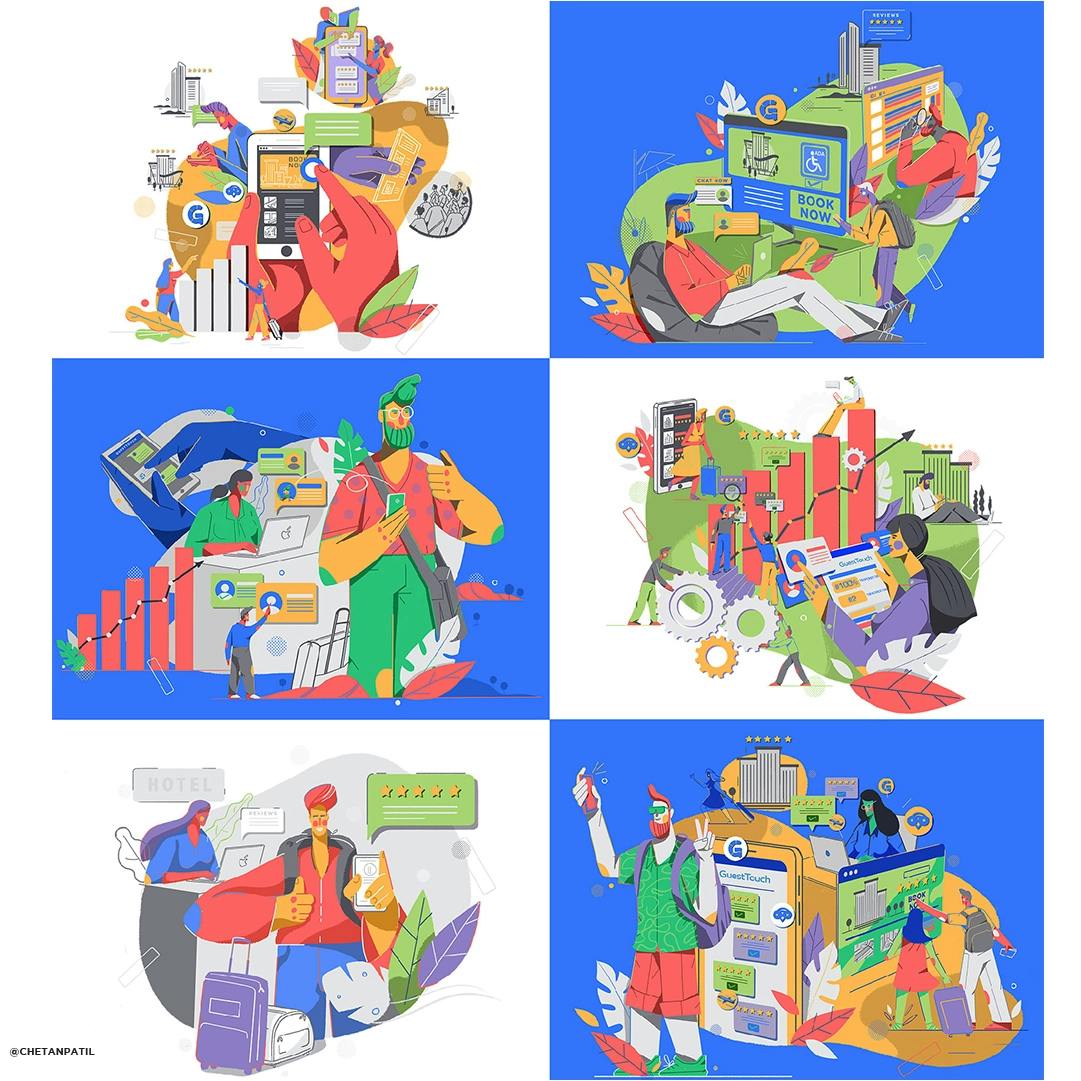
Artwork by Chetan Patil
So, what are the different types of infographics?
There is no one-size-fits-all approach when it comes to infographics and each style serves a different purpose. The most common types of infographics include statistical infographics, informational infographics, timeline infographics, comparison infographics and process infographics.
Statistical infographics are best for presenting data and numbers, while informational infographics are great for explaining complex concepts or processes. Timeline infographics are ideal for displaying chronological events comparison infographics are useful for showcasing differences or similarities between two or more subjects. Lastly, process infographics are perfect for breaking down complicated procedures into easy-to-follow steps.
Choosing the right style of infographic for your project is crucial for its effectiveness. To select the perfect style, you must first understand the goal of your infographic and the target audience. For instance, if your goal is to present numerical data to a general audience, a statistical infographic would be the most suitable choice.
On the other hand, if you are creating an infographic for a specific niche audience, such as healthcare professionals, an informational infographic containing technical jargon would be more appropriate. Additionally, consider the platform where your infographic will be published. For social media, a visually appealing and concise infographic would be ideal, while for a research paper, a more detailed and data-heavy style would be suitable.
Benefits of Using Infographics
One of the significant benefits of using infographics is their ability to capture and retain readers' attention. As a society with an increasingly shorter attention span, infographics are an effective way to communicate information quickly and effectively.
By using vibrant colors, eye-catching designs, and minimal text, infographics compel readers to engage with the content and absorb information effortlessly. Research shows that infographics are 30 times more likely to be read than text articles, making them a powerful tool for content marketing and education.

Infographics are Essential for Your Business
Now that we have explored the different types of infographics and how to choose the right style, you may be wondering what tools you can use to create them. Luckily, there are several user-friendly and affordable tools available, making it easy for anyone to design professional-looking infographics. Some popular options include Canva, Piktochart, Venngage and Visme. These tools come with pre-made templates, drag-and-drop features and a wide range of design elements, making it easy for even non-designers to create impressive infographics.
In conclusion, infographics are a valuable asset for businesses, marketers and educators, offering an effective and engaging way to present data and information. By exploring the different types of infographics and choosing the right style, you can elevate the impact of your message and captivate your audience.
Consider the goal of your infographic and your target audience when selecting a style and use user-friendly tools to design and create professional-looking infographics. With the increasing demand for visual content, incorporating infographics into your projects is a must-do to stand out from the competition and effectively convey your message.
In summary, here are the key takeaways from this article:
- Infographics are an effective tool for visualizing complex data and information.
- The different types of infographics include statistical, informational, timeline, comparison and process.
- To choose the perfect style, consider your goal, target audience, and platform where the infographic will be published.
- Infographics are more engaging and have a higher retention rate compared to traditional text-based formats.
- Popular tools for creating infographics include Canva, Piktochart, Venngage and Visme.

